NEM (XEM) Price Charts

“I am just a dreamer” sings Ozzy :smiley:

For me 2 or 3$ as max before snapshot is derived from logic of waving. XEM does not have time before snapshot to make this upmove as wave 3rd of highest tier, that is the reason why I this move prefer to present as corrective X after W made from 2 to few cents. Max possible for waxe X is around this 3$. Thats all. I dont say about further future, maybe in this future (after snapshots drop) XEM will make wave Y and after that another one waxe XX or wave 3rd of hihest tier, who knows;)

I may be wrong of course if XEM will do 5$ or more $ it will go beyond that much much higher in June (as wave 5th and ending of bubble). Only the market has always full right.

https://www.tradingview.com/x/4WLPJtdT/

Good that market decided not to fulfil this formation.

https://www.tradingview.com/x/kFnZ3nfW/
alternative
https://www.tradingview.com/x/FKhADG9a/
but
https://www.tradingview.com/x/I7wccC4e/
this not looks like 5th, only like abc

so for continuation 1590sat needs not to be broken (maybe 10 satoshi lower is aceptable)

https://www.tradingview.com/x/GCrCeupT/

One more wave please from market at last to 1$ or 2150sat :wink: before bigger correction

3 Likes
  • Snapshot: 12th March 2021
  • Snapshot Height: 3,105,500
  • Launch: 15th March 2021

You can check block height on:

https://explorer.nemtool.com/#/

1 Like

The available supply of XYM will be lower than supply of XEM.

At public chain release, the supply will consist of about 7.3 billion XYM, allocated to users based on their holdings of XEM on the NEM blockchain. Another 1.7 billion XYM will be created as inflationary rewards over time.

2 Likes

https://www.tradingview.com/x/PNg6beMd/
https://www.tradingview.com/x/CIN2xf4y/

suckers, chickens and losers ;D want retest 1500 and 77cents

https://www.tradingview.com/x/p9YxaEJK/
1:1 ratio is nearing @1543sat

https://www.tradingview.com/x/rxxSkkvk/
and @77cents

https://www.tradingview.com/x/53xjDFVH/

all significant resistances up to 2$

1 Like

@ormurinlangi

I checked the charts of the XRP around the Sparkle airdrop, and also IOST (who had an airdrop last week)
There is no sudden dump right after the aidrop, Is there a chance of similarity for XEM ?

1 Like

Check the NXT chart in december 2017 :smiley:

Some chances always are, in case of superbull in broad market drop may be not so significant, in case of dropping broad market chances will be huge.

I will definitely not dump XEMs after snapshot if they will be priced @0.3$ better to keep XEMs for the May/June cryptopump :wink:

1 Like

https://www.tradingview.com/x/nIoODqyh/

Bitcoin should stop @52000 for a while, XEMBTC needs a breath

1:1 ratio XEMBTC is not respected, so maybe 77cents will be

https://www.tradingview.com/x/W0UKN0GN/

very often market tends to back to some low of wave 4th (beginning of some wave 5th)

This intraday waving does not mean anything for my expectations, still 2-3$ expectation is valid!

edit//

https://www.tradingview.com/x/6FhSe1dI/

big fishes react @77 and near 1500satoshis

4 Likes

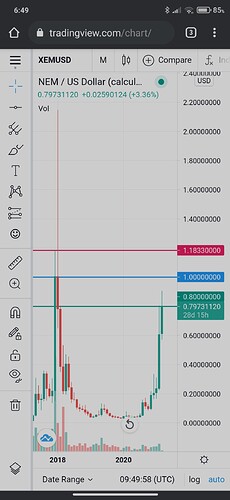
Notice in the image there are three resistances before reaching the prior all time high of $2.09. The first resistance at $0.8 (green line) is being tested now.

Then there is the second resistance at $1 (blue line). And the third resistance at $1.18 (red line) that needs to be broken before going straight to the all time high of $2.09.

Smash the :heart: button if you agree with my analysis :rocket: :waning_gibbous_moon:
4 Likes

parabolic should be continued up to 1$+

https://www.tradingview.com/x/ZDi0dyQo/

as wave 3rd (black) can be max 7x wave 1st in time
they have max time to do that to around 15.00 GMT (+/- 1 hour)
wave 3rd (black) can have now max length in price up to 1.25 also max x7 of 1st wave.

2 Likes

https://www.tradingview.com/x/KVA6dkSv/
https://www.tradingview.com/x/6xO6BMZ8/

squeeze that longs one more time;)

hopefuly Bitcoin has ended this ride for a while, to much is to unhealty

https://www.tradingview.com/x/w65aPHPp/

Not much time to do that pump before around 16.00 GMT, but maybe market chosen another way of waving, “that what is postponed, will not runaway” or “what is to hang will not drown” (proverbs in my country)

2 Likes

https://www.tradingview.com/x/mgcunvsu/
https://www.tradingview.com/x/jmutBJCB/

wave 5th must do top in time no more than 6x time taken by wave 3rd

this kind of counting is also possible as market neglects the opportunity to pump more, so if not must correct, but minimum correction for that kind of impulse is 23.6 Fibo, can be of course more, market will choose level

yes but has been dancing with bitcoin for two hours now

1 Like

all technical analysis indicators on tradingview show “STRONG BUY”
You can find this on the bottom right (tradingview chart)

1 Like

if all indicators shows strong buy it means it will likely dump :smiley: not always but i had observed that kind of situations

XEM is however in strange play with snapshot, so all is possible

as i wrote before this intraday waving does not mean much to me, my target is clear, but waving must be watched to estimate when is better to sell

if i will be waiting for indicators that they show strong sell i will probably sell for nothing :wink:

https://www.tradingview.com/x/yvhQG2kn/

Bitcoin stop is not only from “strong buy” indicators and resistance it is combined with profit realisation by the falling wedge players

1 Like

https://www.tradingview.com/x/M0x9PBQS/

huh strong buy you say ? :smiley:

last chance for bull before 7 line

if they will do that wave can reach 1$ or can be only truncated wave, lets observe

XEMBTC double bottom near 1500sat

1 Like

yep, you have right!
NEM let bitcoin behind and decide to go alone to 1$

2 Likes

its fading, some big fish buyed but no continuation, looks to be truncated wave, unfortunately, not this time, maybe tommorow, or maybe some other kind of counting this inner inntraday waves, market always hides his stance :smiley:

BTC is much more convenient asset than XEM to do technical analysis. XEM is like thunder, you dont know when and where it hits.

2 Likes

Okay impulse has ended @86cents, its the first awaited by me in scenario that XEM will go to 2$ (one of two scenarios, other is with wxyxxz correction instead of ABC and can reach 3$)

https://www.tradingview.com/x/RtwyqU1E/

impulse was retraced by 23.6 Fibo so any ride up can occur in time chosen by market forces, however this impulse to 86cents can be retraced deeper, market will choose the way.

XEMBTC has minimum to do 3000satoshi i described that here long time ago. If it will be 3000sat x 60000$, 3000satx 70000$ it will be also chosen by market and BTCUSD moves.

https://www.tradingview.com/x/DXpJ5UUt/

That is scenario expected by me in BTCUSD

2 Likes

Huh we had profit takers here:

https://www.tradingview.com/x/DtzirRo9/

https://www.tradingview.com/x/SMlkCCxG/

I read other posts and it say today or tomorrow will be BIG short and will go down to .30 cent. What do you think?