
It did. Thank you
Hi there,
I have my supernode running and sent the message in yesterday. When can I expect to see my SN on the list?
Thanks for all your help.
can you paste the hash of the enroll transaction?
c4ac326670da33a3b3c61a17234dd6e64df04473df2ad951110be6c0ba3ccfe0
Thanks again!
you have an invalid char in the message:
enrollâ 128.199.223.15 awooga da6fa731ab8299a831bf80f292b92b6ee0c2744bbcd71b15530c5ed3ac84fa75
well spotted. I will send again
Not showing as such in my Nano or on the Blockchain
Nembex does show the invalid char:
http://chain.nem.ninja/#/transfer/c4ac326670da33a3b3c61a17234dd6e64df04473df2ad951110be6c0ba3ccfe0
We had this problem with other users too, i haven’t fully figured out all situations where this happens.
Please try again and maybe not use copy & paste?
Sure thing will do.
Hello.
Lately i have problems with my vps supernode.
https://supernodes.nem.io/details/801
Is constantly failing the Computing power tests it passes only 2 / 5 tests in average per day.
I have tried to restart the NIS and the servant but that did not improve the situation.
Then i have rebooted the vps but this also has not done any good.
The node is still failing the tests.
No other changes have been made to the NIS configuraiton.
I attach the link to the latest log file: http://37.59.120.16/nis-1.log.zip
Maybe this could be helpful to find the issue.
If it is constantly failing, the node might be too weak. Either because of a weak cpu or not enough memory.
So what are the specs of the machine and how much ram are you giving to the Servant?
Im getting failures as well, on the height/chain/…
even though the height appears to be in sync?
https://supernodes.nem.io/details/326
http://159.203.19.124:7890/chain/height
Seems your nis was not running for some time and you just restarted it?
I had a similar issue but less frequent computing power failures, upgrading the amount of ram fixed the issue.
Hello.
The vps has dual cpu and 2GB ram. Ubuntu system is running on it.
I hope this data can help with diagnose.
CPU specification from “cat /proc/cpuinfo”:
processor	: 0
vendor_id	: AuthenticAMD
cpu family	: 21
model		: 0
model name	: AMD Opteron(tm) Processor 6386 SE
stepping	: 2
cpu MHz		: 2800.000
cache size	: 2048 KB
physical id	: 0
siblings	: 4
core id		: 0
cpu cores	: 4
apicid		: 0
initial apicid	: 0
fpu		: yes
fpu_exception	: yes
cpuid level	: 13
wp		: yes
flags		: fpu vme de pse tsc msr pae mce cx8 apic sep mtrr pge mca cmov pat pse36 clflush mmx fxsr sse sse2 ht syscall nx mmxext fxsr_opt pdpe1gb rdtscp lm constant_tsc rep_good tsc_reliable nonstop_tsc aperfmperf unfair_spinlock pni pclmulqdq ssse3 cx16 sse4_1 sse4_2 x2apic popcnt aes xsave avx hypervisor lahf_lm cmp_legacy extapic cr8_legacy abm sse4a misalignsse 3dnowprefetch osvw xop fma4 arat
bogomips	: 5600.00
TLB size	: 1536 4K pages
clflush size	: 64
cache_alignment	: 64
address sizes	: 40 bits physical, 48 bits virtual
power management:

processor	: 1
vendor_id	: AuthenticAMD
cpu family	: 21
model		: 0
model name	: AMD Opteron(tm) Processor 6386 SE
stepping	: 2
cpu MHz		: 2800.000
cache size	: 2048 KB
physical id	: 0
siblings	: 4
core id		: 1
cpu cores	: 4
apicid		: 1
initial apicid	: 1
fpu		: yes
fpu_exception	: yes
cpuid level	: 13
wp		: yes
flags		: fpu vme de pse tsc msr pae mce cx8 apic sep mtrr pge mca cmov pat pse36 clflush mmx fxsr sse sse2 ht syscall nx mmxext fxsr_opt pdpe1gb rdtscp lm constant_tsc rep_good tsc_reliable nonstop_tsc aperfmperf unfair_spinlock pni pclmulqdq ssse3 cx16 sse4_1 sse4_2 x2apic popcnt aes xsave avx hypervisor lahf_lm cmp_legacy extapic cr8_legacy abm sse4a misalignsse 3dnowprefetch osvw xop fma4 arat
bogomips	: 5600.00
TLB size	: 1536 4K pages
clflush size	: 64
cache_alignment	: 64
address sizes	: 40 bits physical, 48 bits virtual
power management:
memory specification from “cat /proc/meminfo”:
MemTotal:        2097152 kB
MemFree:               0 kB
Cached:           418872 kB
Buffers:               0 kB
Active:           718388 kB
Inactive:        1335360 kB
Active(anon):     649728 kB
Inactive(anon):   985148 kB
Active(file):      68660 kB
Inactive(file):   350212 kB
Unevictable:           0 kB
Mlocked:               0 kB
SwapTotal:        131072 kB
SwapFree:          50252 kB
Dirty:                40 kB
Writeback:             0 kB
AnonPages:       1634876 kB
Shmem:             68172 kB
Slab:              24916 kB
SReclaimable:       8428 kB
SUnreclaim:        16488 kB
servant is set to run with:
java -Xms256M -Xmx256M -cp
and is set to run with:
java -Xms512M -Xmx1G -cp
this setting were never changed since i 've set the node up the 1st time and
it all run correctly until about 10 days ago when the failing errors have started.
This has happened in past too but rarely and it was enough to restart the nis and servant
and it all run correctly again. This time it seems the restart doesn’t help 
should I increase the servant java memory limits?
hmm…that should be enough and 2GB should be enough too, I have more than one such VPS.
Who is the provider, any chance that another vps on the same hardware is using too much cpu?
I have it on OVH in Roubaix (France).
I have checked the processes with “top” it seems the processors are fine
they have spikes sometimes but the seem to be about 50% load on average.
Regarding memory NIS is taking about 65 % memory (1.2 GB) on average and servant about 17% memory.
here is the result listed with “top” in console.
  PID USER      PR  NI    VIRT    RES    SHR S  %CPU %MEM     TIME+ COMMAND
 4552 nis       20   0 3552324 1.232g   8616 S   6.7 61.6   1939:52 java
 1079 root      20   0 2703272 342612   7940 S   0.3 16.3  35:56.61 java
19737 numbero+  20   0   21888   1548   1104 R   0.3  0.1   0:00.12 top
    1 root      20   0   33208   2184   1368 S   0.0  0.1   0:00.70 init
    2 root      20   0       0      0      0 S   0.0  0.0   0:00.00 kthreadd/109242
    3 root      20   0       0      0      0 S   0.0  0.0   0:00.00 khelper/109242
    4 root      20   0       0      0      0 S   0.0  0.0   0:00.00 rpciod/109242/0
I have checked the in the control panel the monitoring for 7 days
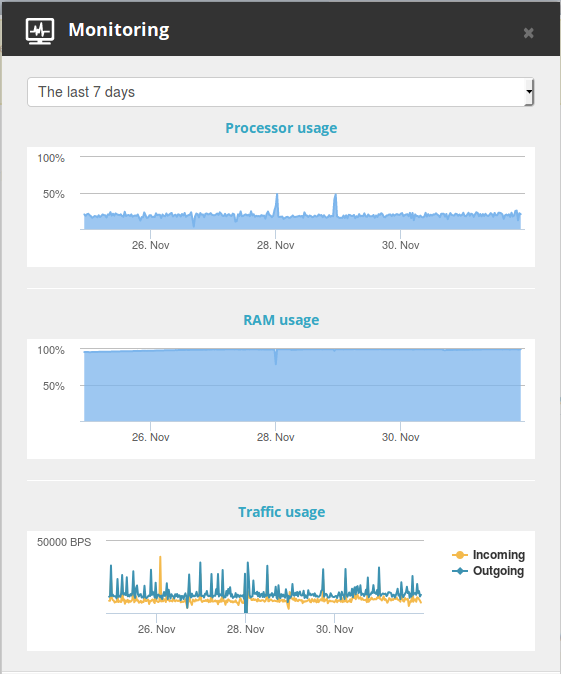
and last 12 months:
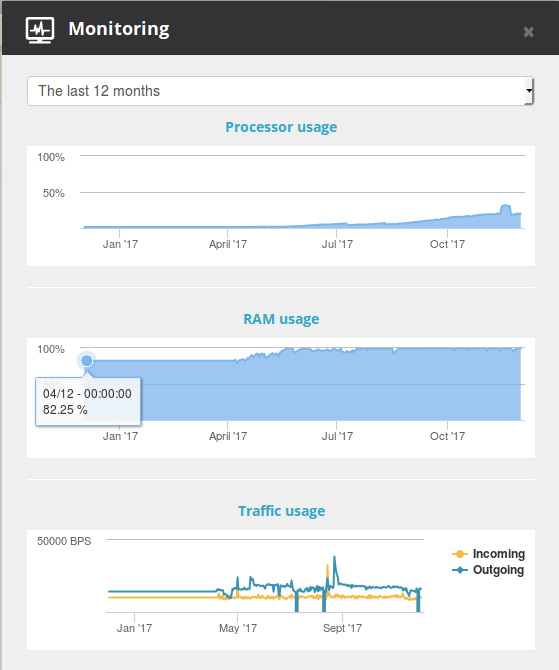
And it seems the memory is completely loaded.
Also after looking at the last picture it seems memory usage increased by the end of July but even then i did not have that problems with failing node. 
@freigeist: not sure what the problem is. Could you add
-XX:+PrintGC -Xloggc:"./gc.txt"
to the startup parameters for NIS and Servant to log the garbage collections?
Also i usually have
-Xms1G -Xmx1G
for NIS so java allocates all memory right away.
Aside from that, the only difference to my nodes is that i usually use debian 8, not ubuntu.
But still, your node should run longer than 10 days without problems.
Ok I have done as you suggested here and restarted both java processes.
I will leave the the node work for a while.
I can already tell you that there are some errors logged to the gc.txt files.
Let me know how much do i need to wait (leave the node working) before i paste the results here.
Thanks.
There are no errors in that file, just garbage collections. The allocation failures in the log just mark the begin of the garbage collection.
Anyway, we have to wait untill the system begins to fail tests again.