It seems like XEM will reach its all time high of $2.09 before Symbol Launch!
Let’s go!

It seems like XEM will reach its all time high of $2.09 before Symbol Launch!
Let’s go!
If XEM price were $1 today, XEM would be ranked 12 on coinmarketcap!
Next resistances for XEM price are $0.65, $0.8, $1
Bigger picture and what i think is drawed by market (probably but not for sure)
https://www.tradingview.com/x/K9Y2Y6Yl/
logarithmic
https://www.tradingview.com/x/QHn0GGum/
BTC looks good until respects blue lines (logarithmic)
https://www.tradingview.com/x/7LMyy701/
TMCexclBTC respects too
https://www.tradingview.com/x/pXL2hd9J/
2$ should be reached week or few days before snapshot.
2$ is not strict limit for corrective structure like this, can be even 3$ but in this case wave “c” will have around 2.618 ratio to wave “a” (depends on correction done after “a”)
Its my vision, not prediction. The best prophet is market. I know one prophet, but he unfortunately not know XEM, only Bitcoin and know about cryptocurrencies but not as player 
He says March is end of some upwave, April bad for crypto, end of April/May good for “refueling”, June seeking the ways to get out from that bubble (especially form Bitcoin). Some after effects for small altcoins in Summer but limited by worsened World situation (warmongers, crisises etc.). Crash in USA and their satelites when Fullmoon in Aries.
BTC and crypto is like caged canary once used by miners to determine the level of poisonous gases. Death of canary will show time for evacuation from every speculative and leveraged market on earth. Only Palladium and Gold will be good at that time to seek safe haven. Not in any FIAT nor Crypto.
I should not do this, but when someone hates this charts dont look at it 
It not predicts it describes situation after!
https://www.tradingview.com/x/DMpRz00f/
BNB is as smaller canary. Some impulse has ended with no doubt, but this impulse can be always part of greater impulse. Until second blue line is untouched all is possible here. It is common for market to retrace near the area of wave 4th, but not for 100%, market do that often, only in last stages of pump avoids to do that and in this case that avoiding can mean that it is really FOMO wave. In this case touching by price territory of wave 4th means of course further bubble bursting. On contrary, successful attack at around 350 can mean building further bullish waves up to 965$. I can imagine that and i am curious what the market will do. For TMCexclBTC further growth here will be better.
https://www.tradingview.com/x/VK9z9Ond/
https://www.tradingview.com/x/Zx4bEdAW/
Ethereum looks to be a problem (temporary i hope) for TMCexclBTC (together with BNB correction). And this divergence on daily chart looks like propells that correction.
TMCexclBTC looks not definitely as bubble, to say that it is bubble it needs to grow to few trillions of dollars at least.
Bearish Monday instead of Sunday, yeah whatever.
https://www.tradingview.com/x/Zx4bEdAW/
i will hunt on basis of Ichimoku combined with previous waves supporting areas.
0.5% capital @48 and 0.5% @42cents
not guaranteed that market will be so kind, but i will give this a chance.
If XEM price hits $1, there is no resistance to the all time high of $2.09. It might go straight from $1 to $2.09 in a straight moonshot, in a couple of days!
Xem whales will buy mansions, Lamborghinis and peasants like me will buy new sneakers, laptops!
https://www.tradingview.com/x/7Xcic3oX/
In the meantime, before lambos, many will now lose some hairs from their heads.
1:7 ratio was the problem for ETHUSD, respecting this rule shows that there are some rules of EWT working regardless of traders thinking.
But now its only correction, ETH was not in bubble (only in first stages). minimum correction is 23.6 Fibo so around 1600 in case of ETH. Not guaranteed, can be more.
Shame that XEMUSD cant do 1$ in one shot, must wait for changing bias by market (some of You remember inverted rune Wunjo for February and XEM? Yep this is it, wide market circumctances can ruin every expectation, only for a while - because for March was rune Ansuz) or some special info from the Team. I hunt further no matter what wide market will do.
https://www.tradingview.com/x/qzipi00p/
I will change only strategy to hunt near that blue line
Not a trading advice, DYOR!
I thought XEM would reach at least $1 this week. My plan to get me a new laptop is over!
NEM is still up big over the last week, if you start panicking from this small dump you are in the wrong market
Panic is not good. I have awaited that 1$ or 1500sat but its postponed, maybe not for long;)
https://www.tradingview.com/x/JMKtZh0V/
BTC respects that line, market is in frenzy, but acceptable frenzy.
Logarithmic lines are to confirmation of waves counting. This was not logarithmic, was to buy and some players utilized this. Lets observe if this will be dip or market will do another one. I saw no divergence on 1h chart or 15min chart so nothing is for sure.
Remember: if someone says that will buy Bitcoins (like Apple) he will do everything to cause some dump to get it cheaper. Only Elon is so crazy to buy after he said he will buy not waiting or causing dump. Other thing is that someone who said he will buy can cause pump to dump higher. So the market works. Wild market.
and now where BTC stops?
https://www.tradingview.com/x/jqDRnuxJ/
https://www.tradingview.com/x/Il9jiuou/
at previous logarithmic line that he has not respected.
and now if he not respect this first nonlogarithmic line, he will test with high probability the lowest one.
I really hope it’s just a small dump!
https://www.tradingview.com/x/jy0mKPes/
ETH similar to BTC respected that non-logarithmic line, if that will be broken, blue rectangle area will be tested with high probability as inner wave 4th area…
https://www.tradingview.com/x/OaG7AusH/
which correlates with BTC inner wave 4th area
in both cases high of inner wave 3rd can be good support too
https://www.tradingview.com/x/tn4FfxiL/
XEM does not touched his first support line. BTC and ETH does it.
That’s all in hands of NEM Team, they must say when is snapshot and it should cause catapult in price Second catapult (to 2-3$) when time of planned snapshot will be nearer, in this case market must be in full bull. This must be done in March, especially in first half of March. The later the more risks.
Ethereum network congestion sigh. What a s…tcoin
XYM will have superior technology, than s…coins like that.
For me congestion was caused by magic of 1:7 waves ratio (and maybe some bad whales, wanting to cause that dump, alongside with EWT rule), the same was in 1:6 ratio for ATH of TMCexclBTC between waves 3rd and 5th of highest tier.
I am curious if we will see congestion of BTC network @ 144000
looking at charts i’ve found very bullish sign, candlesticks on 1h are rare respected by market but this candles combination (engulfing with hammer)
is spectacular for me
https://www.tradingview.com/x/nEcdTu30/
https://www.tradingview.com/x/UZzcVQMZ/
https://www.tradingview.com/x/L976cqfk/
and volume of that hammer is significant
https://www.tradingview.com/x/bMWwRyi4/
three white (green) soldiers with hammer too
I think we are going to the moon towards the all time high at $2.09 now that it has been confirmed that testing were successful!!! @ormurinlangi give us an exact date as to when XEM will hit $2.09!!!
marvelous and price reacts
i dont know which day it will be, chart must be observed or alerts must be set
Maybe 1.5$ is even possible after date anouncment, and 3$ short before snapshot
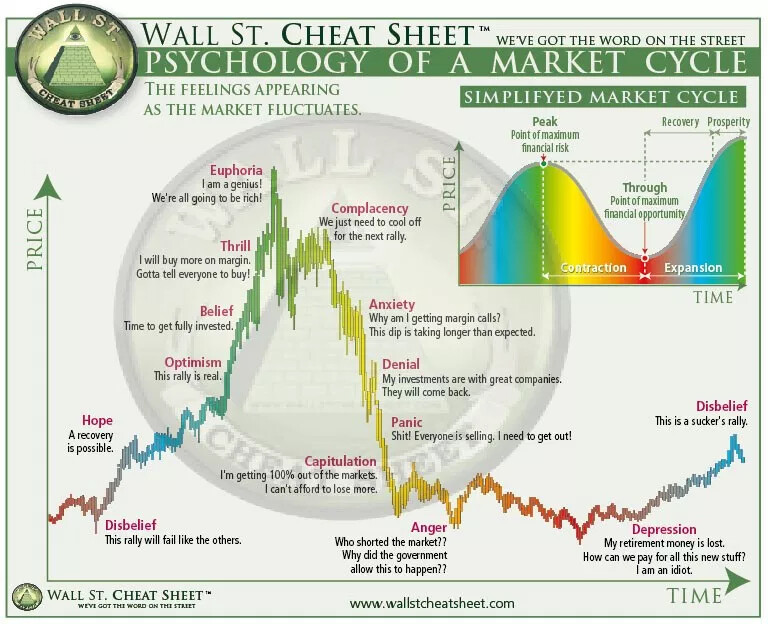
I think we are in the Belief (Time to get fully invested) phase of the NEM bubble cycle!!! To the moon!!! Do you agree with me @ormurinlangi !?