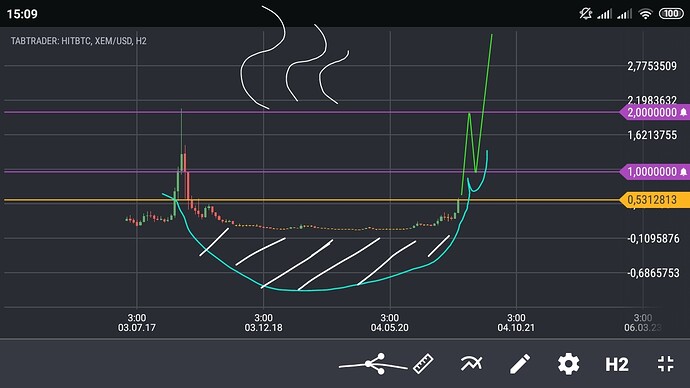
NEM (XEM) Price Charts

and 1000 satoshi touched, 0.58, not exactly but near, so is the rythm now, Asia buys, berserking Bitcoin in the mean time forces correction shapes

0.9 area cane give bigger correction (bigger mean 20 to 40%) but time is not guaranteed to last long.

https://www.tradingview.com/x/XOrFnys0/

if this was really wave 3rd (1:1 with 1st) time to end wave 4th is ending at around 7:30 GMT, if not waves must be recounted.

https://www.tradingview.com/x/DY04X9P6/

the red line is invalidation line for this counting

2 Likes

Next tuesday so You mean 2nd March? Intresting :smiley:

1 Like

1 Like

https://www.tradingview.com/x/LrHQeFWq/

counting invalidated by this market moves, now waiting for dip to calculate it better

BinanceCoin is correcting (i dont know that is the end because has place to grow up to 965$ theoretically) and other coins in TMCexBTC reacts. Even BTC reacts as well.

https://www.tradingview.com/x/MOCNOyZ3/

and ETH:
https://www.tradingview.com/x/SRaAQajV/

made 7x of wave 1st in that kind of counting, i dont know if this counting is good, but double top was made near this 7x level

https://www.tradingview.com/x/hcwtg8dq/

Bitcoin as i wrote earlier in my posts has max possible 144000 to do in move from around 4000 bottom (max possible theoretically as extension of smaller wave 1st, that level if reached should cause 20-60% correction before next upwave), but some problems can be around 77000, as counting is similar in form to ETH, but pricing looks diffrent as percentage of growth of course.

https://www.tradingview.com/x/6P5GabmR/

https://www.tradingview.com/x/JEpa1WPC/’

I am not surprised this green 1:1 ratio realised in this kind of counting

robots make everything so complicated, as they trade possibilities

https://www.tradingview.com/x/FuCD275c/

they have found this possibility so they sell

but robots dont have intuition nor insider info;)

https://www.tradingview.com/x/uflU50pC/

waves rethinked and recounted, some deeper correction looks to be possible but not required as impulse was retraced more than 20%

https://www.tradingview.com/x/MBEtJr8W/

and strong support now around 850satoshi

https://www.tradingview.com/x/AC855MGj/

intresting bubble bursting or correction before making 965, this last wave can be 5th or 1st in 5th, always is some uncertainty in case like that

https://www.tradingview.com/x/H3WRHNe2/

for me bubble bursted on this sh…tcoin

but thats affects TMC and XEM

https://www.tradingview.com/x/dDqCLZ0s/

nice

1 Like

Sunday is the sales?
Still a little lower and I buy again before the big announcements of the crypto markets

2 Likes

BNB bursting (wass really to fast overpumped, but hard to say it is the end, some hope for players there still exists) along with ETH reaction on BNB and double top possibility (small double top intraday) caused yesterdays drop, Sunday yep may be bearish like it was before.

https://www.tradingview.com/x/ULjqmvnU/

that counting needs to be confirmed by breaking blue lines

and even in that case it should be only corection of BTC before March ride higher

https://www.tradingview.com/x/Vm6RRRH6/

here similar

Market during bursting of some coin bubble (like BNB high in TMC) retraces partially to FIAT partially to BTC, smart money should now hunt not overpumped coins with speculative background (like XEM), but must have confidence in BTC to do so.

https://www.tradingview.com/x/1eBxsmJQ/

XEM without fundamental info/or Asian pumps is strong related in bearish moves with TMCexBTC

Personally i hodl regardless if it will drop along with broad market or not. Snapshot speculation is worth the risk. There is some intresting rule - buy the rumors, sell the news/facts :wink:

3 Likes

Huh it looks like now Sunday is bullish :smiley:

Yeah wathever, corrections like this should be shorter in time before big rush in March.

XEMUSD still reflects TMCexBTC moves, in case of growth its gooood.

1 Like

You are just guessing price predictions with this nonsense wave thing. Yesterday you said: “bubble bursted on this sh…tcoin”. Now you say: “Huh it looks like now Sunday is bullish”.

1 Like

he is a troll I think. I dont know why he write 10 very long messages everyday here.

1 Like

I enjoy reading it, he is providing his own analysis using Elliot wave theory, I don’t know much about wave theory but it’s interesting to learn and see how the predicted waves hold up as the timescale changes. The ‘shitcoin’ was BNB.

2 Likes

From logical point of view bubble has bursted a little, there is no minimum time for correction (in EWTheory) so it may be done in one day and it was almost 38.2 Fibo from top of BNB. This bursting has affected TotalMarketcap and moves of altcoins so whats the problem? BNB is not my coin. I have XEM, XRP, Stellar and few other minors.

Beside that You dont understand what Elliot Waves Theory is, it is not for prediction, for prediction is tarot reader or I-Ching :smiley: It can only build expectations, or helps to avoid FOMO, i You see potential 5th wave.

I can only describe my own expectation based on theory of waves. I am not a prophet (i use cards, but only for my knowledge, and i am not professional)

I know one prophet in my country and he says that significant top in BTC will be in March and after correction in April, in June. We will see if this prophet is on right track.

And above all - humanum errare est. I know that i know nothing.

2 Likes

Nobody can predict the market. Wave theory does not make sense because waves in prices are formed by news and events that influence price, and are not formed by scripted 1st 2nd 3rd 4th 5th waves

2 Likes

This topic is only for free interpretation of charts, many people can have other approach. Respect it please.

Beside that i shouldnt show my intraday charts, it may lead to misintepreting of my “bigger picture” expectations.

Bigger picture is always better than intraday chart.

2 Likes

https://www.tradingview.com/x/QLefFWlp/

And one example that EWT is worth of effort. bulls hunters in terittory of wave 4th (some minor, intraday tier) combined with line (logarithmic chart) that works perfectly with that blue rectangle. This method is good enough for me when i hunt for some coin. I make mistakes of course, but crypto in bulltrend combined with that what is on picture, gives this huge chance for patient players to minimize risks in entering in some coin. For me is better buying in that kind of moves than in wave of FOMO. Entering like this can be combined with daily ichimoku chart. Where is exit? I hope for 1500sat/0.9-1$ But i dont say that everyone that read this must play in that way. Everyone should DYOR.

From this time i will publish here only my entries, but that will be not trading advices! So not what i think about current situation, only what i play.

1 Like

waw, you counted the EW on a already passed chart :slight_smile:
It is easy to do it with a chart that has already happened. It works 100% since you always can make the wave if you change things such as timeline (1h, 1d, 3d etc…)

But doing it to predict the future never work.

Selling should be done in basis of candlesticks, divergences and waves extensions, not only on one method with so many possibilities in case of extensions. Life is not easy that is true. Here is not place to do prophecies. Only market players expectations/speculations from current price action.

Strange time for pumping, but i like it :smiley:

There are two levels of my expectations 1500 sat and after some correction 3000sat. Only my expectations, not predictions!

3 Likes

Many are waiting for Dave’s announcements, others are already buying and some of my friends are waiting for the markets to open (Nikkei etc) But all are very motivated to buy Nem Everything should move a lot this week

5 Likes