
Be my guest;)
https://www.tradingview.com/x/Vf0OInCr/
Just a little bit nearer rectangle (or 42000 previous top) and Elon will be under water with his Bitcoins. That is FOMO loser 
Joke. I am curious if he will be hunting in that area. He and other big and bigest fishes.
For haters or enthusiasts of EWT
https://www.tradingview.com/x/rIENMIqu/
Logarithmic version of chart shows upper blue line broken by this dump (BTC tried to rebound but with phyrric victoria) was signal that structure builded from end of January was impulse. If this impulse is part of bigger impulse or wave 5th i dont dare to judge. All i know that after 5th wave market tends (with 95% certainity) to penetrate area of wave 4th or at least touch the top of wave 3rd.
Similar structure have builded XEM on his chart (impulse). Yep it looks like old story telling but one more time EWT is not for predicting! Its for building expectations for short, mid or longterm. And helps build battleplan, because investing is like war. One lose battle not mean we are lose whole war.
You will rarely have a chance to sell a top, but logarithmic and geometric lines helps to exit from asset like this in right moment (after some rebound). I decided not exit from XEM in this case, because i like that coin and will like XYM. Other shitcoins i can dump, but not XEM for few fooking cents.
https://www.tradingview.com/x/jKWeqvzg/
this shows even better (nonlogarithmic) significant points after breaking lines that BTC tries to recover, but for now it fails.
Sad thing is XEM is still late to party, this today statement was too late about two weeks. I’m not blame The Team. Bad Luck that’s all.
edit//
https://www.tradingview.com/x/7PDs0UiH/
i always look for some reversal signs, double bottom with inverted H&S formation, timeframe is small, yesterdays three green soldiers was smashed by further dump in broad market, but who knows, observe.
https://www.tradingview.com/x/p2WRwcvJ/
market after succesful retaking of that line
https://www.tradingview.com/x/O9WP1M3K/
can attack pink line area (logarithmic chart)
https://www.tradingview.com/x/CIuD9cIi/
XEMs reflects broad market moves as i wrote earlier that must be reflected now by XEM. Awerness is greater than month ago.
2 Likes
XEM price is recovering. Let’s hope bitcoin stops dumping
2 Likes
may be only corrective move but some wxyxz structure is visible now, this wxyxz can be part of greater wxy or wxyxz structure so we can have only hopes that BTC and TMC will not go deeper. Deeper means cheaper for XEM on contary. But there should be some limits of this cheaper.
1 Like
ResumeBullMarket.exe initiated
2 Likes
haha i wish to
https://www.tradingview.com/x/P5YhLJeg/
but “king” struggles to activate small bullish formation and also with the line that has been broken
i wrote who cares broad market but that was too cynical of course, wee need bullish market for XEM growth with no doubt
more hype before 12 and 15 March is needed too
1 Like
All the markets are bleh these past couple days not just crypto. Hopefully the US stimulus getting passed this week helps things along. Poor NEM just getting caught with unlucky timing for it’s rollout announcements.
2 Likes
Guys remember when NEM was #4 on CoinMarketCap?
That was tight!
3 Likes
Getting NEM back to #4 is not likely in current environment, but #7 is ripe for taking.
XRP is trash and sitting in our chair.
Lets FLEX hard. 5x isn’t too much to ask for.
GET OUT OF MY CHAIR XRP!
3 Likes
https://www.tradingview.com/x/8jJRWz21/
The deeper will be correction (wave B) the more room for XEM growth in potential wave C in X. Wave C can have - accordingly to rules of EWT - max 5x length of wave B. Let’s say B will be 50cents long, that gives potential 2.5$ growth from bottom of wave B (let’s say 30cents) - max room in this case will be 2.8$ - not bad. Wave B can be of course much shorter, depends on market mood. After That B and after snapshot i expect that price of XEM will sink in form similar to wave W and will wait for forming of wave Y or other impulsive form in 2024/25 (NIS1 will be still alive).
1 Like
If BTC revisits 20 week MA or EMA this days, might be an interesting chance to catch a long position on XEM-USD pair downthere. Noting too aggressive, just borrow USD to by 50% of XEM I already have on Binance… Hope we don’t go there, just saying:)
1 Like
Time is now to buy XEM at $0.5! Don’t miss this bargain!!!
4 Likes
https://www.tradingview.com/x/topNY6HZ/
baseline of ichimoku acting like support, all still looks like a correction in strong uptrend’
https://www.tradingview.com/x/pyscF34s/
https://www.tradingview.com/x/zQZY3m12/
Those bearish two last candles engulfing in daily chart looks awful, but the time to snapshot is short and to cryptoexplosion in March too.
Wide market rebounds now faster than XEM. Its normal because Asian players had losen their confidence (bearish engulfing after FOMO wave). They will return when some pump team takes the rule.
1 Like
If you are also buying cheap XEM at $0.54 Smash the  button!
Cheap cheap cheap $0.54 XEM! Let’s get this crypto!
1 Like
https://www.tradingview.com/x/y3iPKWlI/
fly little bird fly but not much down, only corrective
https://www.tradingview.com/x/aOvO1ngL/
previous one was fantastic to watch
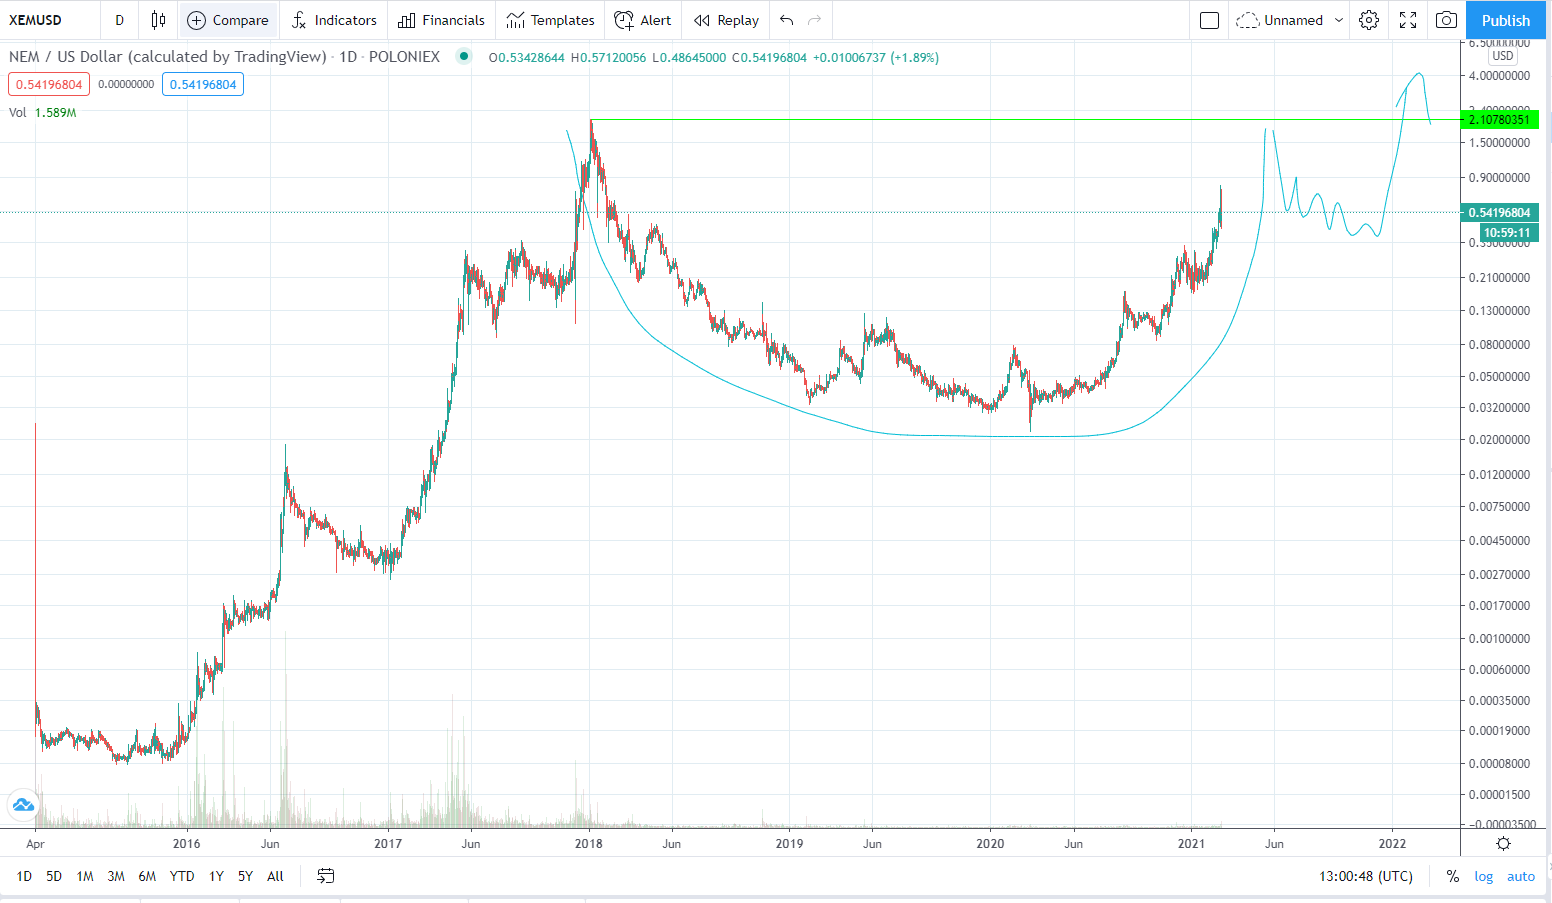
Although I agree there is a clear cup and handle, I wonder if this chart will be useless when Symbol launches and people stop trading XEM.
1 Like
People will always trade XEM as long as there are markets, although yes xem could die if there is no value in holding, it will be discussed in the upcoming Q&A
1 Like
Awesome, but almost impossible to fulfil, geometric target for that is around 4$, without snapshot and more effort from NEM Foundation maybe this and much more could be achievable. Let’s hope XYM will build that story wihtout this.
In the mean time:
https://www.tradingview.com/x/lYZouipq/
https://www.tradingview.com/x/mJGuAXK8/
https://www.tradingview.com/x/IUy62ATU/
shit happens, needs to be confirmed by attack on that thin red lines
edit/ BTC confirmed attack on thin red line but
https://www.tradingview.com/x/SxuNodTv/
TMCexclBTC still holds some geometrical line
all I see here:

2 Likes