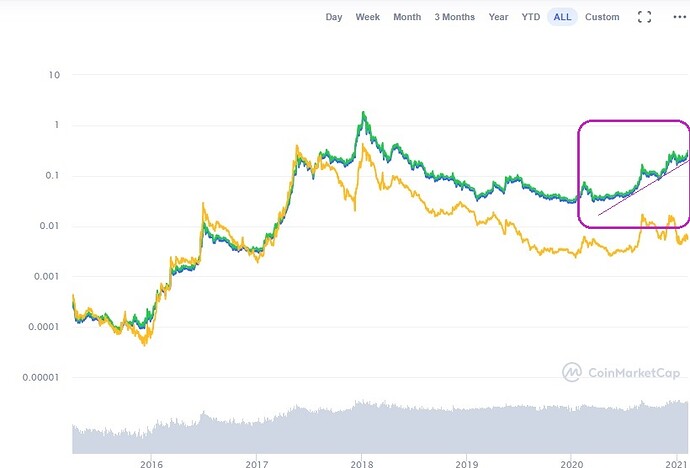
NEM (XEM) Price Charts

Sigh, Bitcoin must definetly stabilize, ruined so beautiful XEMBTC chart… nothing new with skyrocketing BTC, XEM is in group of low liquidity coins unfortunately in that case…

https://www.tradingview.com/x/8iGdRpxh/

very crude anticipation not prediction for the comming days/weeks
https://www.tradingview.com/x/W49bOSgQ/

60000 and my favoured 1:1 ratio (wave 3rd with top @42000, so wave 5th could reach 60000, wave 3rd was overextended in comparison to wave 1st see the bigger pictures below), must be observed for some signs of divergences in this move, unless my counting is not correct, may it be.

https://www.tradingview.com/x/xXv472fb/
https://www.tradingview.com/x/NMKSED1s/

someone has twitted one more time? huh Musk like pumpers :wink:

1 Like

Elon Musk bought $1.5bn BTC. Also Tesla will be accepting BTC as payments. That’s likely reason for rise in BTC. Might put in my order for a Tesla Model X :smile:

Looking at the long term logarithmic chart there’s an upward trend in XEM price since June 2020 to present time, and seems to be continuing at around 40 degree angle trend of organic growth. I am not an analyst, just my observation.

1 Like

Good point. I have neglected this Logarithmic charts. On this chart i see also formation of cup and handle:

https://www.tradingview.com/x/WYHiu7wN/

this cup and handle to be fulfiled must do around 300% up from 20cents, that gives 80cents, precise chart (with candles shadows) gives even 475% from 18 cents - few cents above 1$

https://www.tradingview.com/x/YJwnkMVI/

Musk buys Bitcoin lol. He know nothing about XEM and XYM, just like Jon Snow know nothing :smiley:

All i know is that BTC in this 3rd wave of highest tier can do max 144000$ in this wave of highest tier (rule says about 7 time length of wave 1st) he will multiply his 1,5bln$ x3.5 (minus drop in price that can be caused by massive dump, in fact he can cause little bubble burst, he or group of others, they know the rules of Elliot Waving).

https://www.tradingview.com/x/CImg49GZ/

2 Likes

https://www.tradingview.com/x/cNc8SPyT/
https://www.tradingview.com/x/kBeRW58T/

Divergences shows nearing correction, should not be deep in case of BTC, because he is in strong upmove (wave 3rd in 3rd in 5th in 5th in 3rd)

After Bitcoin will end wave 3rd in 3rd in 5th in 5th in 3rd XEMBTC will be not pressured so strong by factor of Bitcoins growth. This pressure can be lifted of course by strong buys and news regarding XEM. Until 29/32cents area holds, there are some chances for that.

https://www.tradingview.com/x/HvWpxf6B/
maybe that 3rd in 3rd etc. has ended with 1.618 ratio which is confirmed by divergence

Optimistic scenario to fulfil cup and handle is:

https://www.tradingview.com/x/zJm15uJ3/

Optimistic and pessimistic (that showed me reverted rune Wunjo for February and XEM, mentioned in my previous posts), because waving like that always are ended with crash (one day You see 1$ in the second or even the same - 0.5$).

With 8 of Cups and Knight of Wands also mentioned in my previous posts (under condition we will stay above 30c) XEM will reach 1.07/08$ around 17.02 - i hope that i read that properly;)

1 Like

Correction in BTCUSD now cannot be similar to correction of wave 1st, should be flat/ flagor, sideways, or triangle

https://www.tradingview.com/x/Pvg8xS16/
https://www.tradingview.com/x/57qyiqj7/

divergences seeking is the key for shortterm/intraday players, means nothing for non technical holders of course

https://www.tradingview.com/x/H77m7LlY/

second try to retest support area of 30/32cents is likely now, but not in 100% (i d’rather say fifty-fifty)

all depends on this divergence and three withe soldiers candlesticks to be respected by market:
https://www.tradingview.com/x/Gpr35Ro3/

Head and Shoulders if activated can be good for XEMBTC for a while
https://www.tradingview.com/x/k001fgY2/

with that?

https://www.tradingview.com/x/pYdVm3ii/

mmm sweet :smiley:

come on XEM You can do it!
https://www.tradingview.com/x/TDxPOZPO/
not for play this setup of course, to small timeframe and low risk/reward ratio however worth to watching how it works.

here fulfiled:
https://www.tradingview.com/x/cjh1LYor/

but not straight in XEMUSDT pair only requoted

2 Likes

BTCs H&S formation attacked wit good volume:

https://www.tradingview.com/x/2FFxQooL/

and XEMBTC has similar formation, inverted of course:

https://www.tradingview.com/x/J17vyAzq/

https://www.tradingview.com/x/xkFcRWJO/
BTCs formation to be fulfiled must do 43000 (not pharmacy, may be little higher) this is also area of beginning of previous wave 5th of lowest tier, that i showed in previous posts, very logical place to end this first leg of correction, however BTC is in uptrend and bearish formations not always can be fulfiled. whatever it will be BTC corrects which is good.

https://www.tradingview.com/x/S45P1Ian/
attack on the red line will make that formation null and void.

Logical level for some end of first leg of correction was also @45000
https://www.tradingview.com/x/oUJaRyiI/

sometimes market choose previous high, sometimes beginning of previous wave (5th) sometimes 50% between that levels huh:D

If H&S was a trap, what can be next? I wrote shape of this correction must be diffrent than correction of wave 1st. For XEM and alts best will be some triangle or flag. We will see.

edit/ it was a trap, correction still in play, XEMBTC inverted H&S was a trap too… but XEMBTC has three wite soldiers defending.

1 Like

Hi,

I think we will see %30+ gain soon. Check my 15m chart.

https://www.tradingview.com/x/WGuvAFPH/

Thank you

2 Likes

This 30% gain is possible however as i observed this trangles many years i’drather see it diffrent, fake attack on that triangles are often, real are rare, maybe this time will be this “rare”, or maybe… we will see :smiley:

I must also recalculate chart and waving for BTCUSD

https://www.tradingview.com/x/hGA4Gj0v/

Very bullish, i hope this bullish bias will not hamper XEMUSD moves too much. Can postpone, but not destroy.

1 Like

Yeah lets see how it will play :slight_smile:

Do you have any idea what will happen after Airdrop News, and snapshot date?

I think
%200-300 gain news → snapshot date
-%20-30 down after snapshot date

3 Likes

similar ideas but more conservative

100%-200% up in the day of snapshot news (depends on starting point, from 0.5$ only 100%)
50-70% down after that (to 0.3-05$)
week before snapshot attack to 2$

by the way triangle can be drawed like this:

https://www.tradingview.com/x/jm2SExwq/

and attack line holds, but as i wrote, i dont use triangles, maybe as confirmation of trend sometimes;)

https://www.tradingview.com/x/PsPyXSAl/

my intraday shortterm target is located in the same area, where is 30%+ for hypothetical triangle…

https://www.tradingview.com/x/NTj56FNN/
five waves, three white soldiers on 1H chart, what more is needed to attack this night (in Asian session) 40c+ area and nearer 1000sat…

2 Likes

Setup for today XEMBTC

https://www.tradingview.com/x/rlSIkzNK/

https://www.tradingview.com/x/2RZoGkl7/

this triangle is played by market like invisible toy, this waving is fine, until some Musk will buy a bunch of Bitcoins :smiley:

Annoing thing is that XEM goes down on coinmarketcap, now 26 position, others are growing faster.

1 Like

absolute max for upmove if waving like this will be continued (and if properly counted) is 48cents. But take profits by large player/s can be realised sooner of course.

https://www.tradingview.com/x/zDZfCDvK/

invalidation of that counting is around 33.5cents now

For newcomers, never play that FOMO, 5th waves are FOMOs and should be avoided!(unless You scalps the market) Buy retraces and supports testing after FOMOs instead!

1 Like

https://www.tradingview.com/x/mt39yRcF/

very bullish setup for the upcomming hours/days

corresponding with 40cents+ expectations

2 Likes

Yes it looks promosing.

My triangle is working well :slight_smile:

https://www.tradingview.com/x/dJ6PxgUR/

1 Like

in trend should work, this is this “rare” situation for XEM :smiley:

However market tried 3 times to form that kind of shape, i am not surprised with this market behaviour at all.

and every exchange has his own kind of story:

https://www.tradingview.com/x/nwqfRWxa/

this is the reason why I take triangles with a pinch of salt

I am curios this triangle for BTC

https://www.tradingview.com/x/e54GgFMr/

Maybe will be false, but trend is strong. 50/50 play.

2 Likes

https://www.tradingview.com/x/euuKb0pT/

prepare Your seatbelts, tu da MUN :smiley: Asia/Japan is buying…

hahah Bitcoin triangle nice trap:

https://www.tradingview.com/x/EKG0yYYd/

first attack is almost always with some 5th wave of small impulse…

edit1/

https://www.tradingview.com/x/Iss1Yrq9/

so are triangles, tricky

https://www.tradingview.com/x/SFqgom0T/

and it goes now with that way, waiting for confirmation that this upmove ended with failure for a while…

but it changes nothing in midterm (weekly) expectations, only changes shape of correction between 30-36cents

oopss someone tweets something inpositive for crypto? Some globalists? :smiley: Dramatic moves like that are only to retake from weak hands…

or maybe FOMO here has ended?

https://www.tradingview.com/x/TXqehPr6/

for a while (with evil bazzoka)

my proposal for market now is:

https://www.tradingview.com/x/ENpLDRaP/

lets do this correction to produce new upwave properly (without tricky triangles)

valid scenario until 30cents holds…

Market always will choose more complicated way than expected.

2 Likes

https://www.tradingview.com/x/SaUQ49AC/

Sooo there is no better setup to play than this (short/midterm), no triangles, no waves, ni matter shape of correction (waves are only for painting expected scenarios, not for play, in rare cases to show what market cant do, or what min/max can do)

Until XEMUSD stays above 30cent has 40cent+ to do. Period :smiley:

2 Likes

https://www.tradingview.com/x/KlD1fG4g/

Looks like this time BTCUSD bearish triangle is in play.

For XEM that should be better than Bitcoin growing too parabolic.

https://www.tradingview.com/x/GZX0hdL7/

This green wxy will be not confirmed until Bitcoin is above 41000, because this wxy can be waves 1st and 1st in 3rd (or 1st and 3rd where 3rd is not much bigger than 1st).

2 Likes

https://www.tradingview.com/x/8tlfbGMX/
https://www.tradingview.com/x/ze6R7Ez9/

XEM duplicates currently moves of Totalmarketcap excluding Bitcoin. Funny thing is that XEM not tend to do ATH (@2$) just like this marketcap of alts did few hours ago. Funny and sad. This must be changed. For "fook"sake.

https://www.tradingview.com/x/V83nI4hT/

support in the middle of small wave 4th area, intresting…

edit1/

https://www.tradingview.com/x/tyfTOZ91/

1:1 wxy correction, will this magic work?
and this rare moment where BTC, alts and XEM are going the same way…

but not for long, BTC much higher than his ATH from 2017, TMC(ex BTC) around that ATH and XEM much much below ATH… so this three have his own story to write.

2 Likes