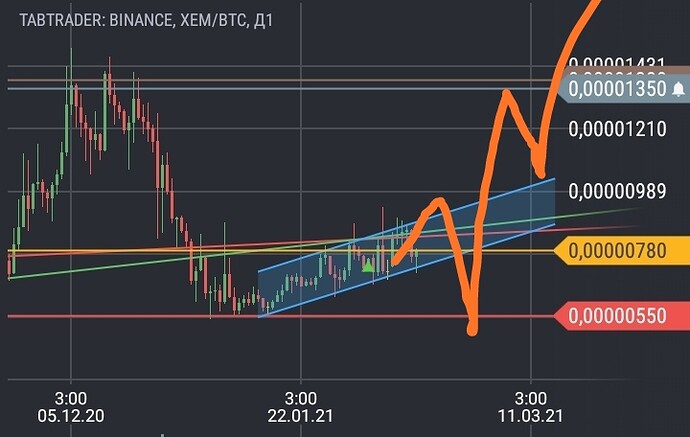
NEM (XEM) Price Charts

https://www.tradingview.com/x/JZCgQ6UB/
TMC(excluding BTC) has room to grow up to around 770 bln, before bigger correction

ETH to only 2000 (intraday can be always little higher)
XEM to 1.5$ (but i expect only 1$, maybe with some high shadow in the daily candle)
BTC to 77000, but here room can be even extended to 144000
BTC is in other phasis of waving than ETH and TMC(exBTC), but all this wavings are bullish longterm.

This values are max possible if i properly count waves and if some divergences will not occur before that values/priece levels. There is no guarantee for that;)

2 Likes

Trend is Your ā€œfookinā€ friend.

https://www.tradingview.com/x/5VrSRmWm/

2 Likes

https://www.tradingview.com/x/sT1KEC47/

:smiley:
Market will choose place of top for wave 5th (in corrective A, because this move is for me correction of freefal from 2$) my expectation is 1$, from EWTheory 1.5$ is max possible for 5th wave.

https://www.tradingview.com/x/FeKuAbwA/

40cents is fulfilment of this triangle - 1st level of fulfilment (length of wave 4), 2nd level of fulfilment is 49cents (length of wave 3rd)

1 Like

https://www.tradingview.com/x/dDSEYeGw/

divergence on 30min or 1h chart should confirm end of that upmove for a whileā€¦

https://www.tradingview.com/x/CB77qhqr/

We have however first divergence now (after break of 36), which always complicates waves counting, but i wrote, intraday/shortterm waves are pain in the ass, because of plenty possibilities to count it, in so volatile market, dependend strongly on BTC moves and his volatility. Only midterm/longterm waves (1D charts) makes some bigger sense. Sometimes ichimoku helps to know how the trend looks like.

Invalidation of this small counting is around 36cents, this is also intraday support levelā€¦

https://www.tradingview.com/x/V7qGiFr0/

bigger perspective, valid until XEM is above 36c

https://www.tradingview.com/x/sC2BMDMd/

correction of impulses almost always like test areas like this

https://www.tradingview.com/x/EHOLvY8g/

similar to Bitcoin actual moves

1 Like

setup that i try to play (800satoshi, target around 1000), for 1% of my Bitcoins.

https://www.tradingview.com/x/BsKY8hPn/

edit1/ argh :laughing: iā€™ve got three waiting orders @795, 800, 805 and i have only partial entry @ 805 (0.333% of my BTCs stack)

edit2/
Prepare Your seatbelts (i hope)
https://www.tradingview.com/x/ceonIs5A/

edit3/
https://www.tradingview.com/x/A5MHzSEo/

they creepin little by littleā€¦

ā€œNo more than 10 consecutive replies are allowed. Please edit your previous reply, or wait for someone to reply to you.ā€

If You want have my new posts here, please comment sometimes, due to 10 consecutive replies in topic allowed :smiley:

1 Like

Some more good news for BTC which will help crypto from a macro perspective

  • BNY Mellon, Americaā€™s oldest bank, has said that it will be adding support for Bitcoin

  • Twitterā€™s chief financial officer says the social network is considering how it might pay employees in Bitcoin, and could buy some crypto for itself. Itā€™s well known that Jack Dorsey, Twitterā€™s CEO, is a crypto enthusiast.

  • Mastercard is going to support cryptocurrencies on its network by the end of 2021. It means card owners will be able to pay merchants directly using digital assets.

  • It appears that Amazon is set to launch a new payment project in Mexico. The posting was asking for computer scientists to apply. The successful applicant would help launch a product that would enable users to exchange cash for digital currencies, which they could then spend online.

2 Likes

BTC market cap is now worth more than JPMorgan Chase, Bank of America and Wells Fargo combined!

1 Like

Thanks suky321 for that informations;)

Market gave me some time to recalculate inner waves and now it looks like from 32 to around 40 we have 1st wave in 3rd in 3rd in 5th which is good for frther growth perspective. This wave 1st cannot be the 3rd as correction after that wave is too long (should last max 2x time of hypothetical wave 3rd) its complicated i know but for now looks like:

https://www.tradingview.com/x/tFQRqq0H/
https://www.tradingview.com/x/6V4uWxSa/

Rectangle is tested now well as a support area and it should be so, correction looks to be ā€œmegaphoneā€ shaped, which is rare.

Confirmed breaking of 36cents will invalidate this counting, but not invalidate bulishness at all.

Maximum time for correction of 1st wave (pink 1) is 9x time that taken this wave, but i doubt that this correction will last all of this time. From this ā€œmegaphoneā€ market can make ā€œdiamondā€, after that should be much more dynamical in upmoves.

edit 13.11 9:11 CET//
https://www.tradingview.com/x/sBi2jr3J/

market tests this dotted line second time, the line is based on 1H priceline chart, not on extremal prices. On extremal is based lower solid line (for extremums of Binance XEMBTC recalculated to XEMUSD chart)

1 Like

https://www.tradingview.com/x/NJV9YAB7/

dotted line under fire of wide market retrace

I dont dump my XEMs now for other better kicking projects

https://www.tradingview.com/x/yo15Ez2q/

solid line is the line of last chance for very bullish trend

https://www.tradingview.com/x/ao4JohqP/

Mainly looks like this intraday dump is caused by TMC(exBTC) big players portfolios conctruction (XEM has his place in that porftolios for sure).

https://www.tradingview.com/x/sHBIdgwQ/

some correction was needed here before March upmove.
Still is the question it is now? Divergence says yes. But divergence is only one tool.

This inverted rune Wunjo that i drewed for February and XEM is like thorn in the ā€œbackā€. Nooone like postponing growth to much, but what to do when market and other forces says stop for growth.

https://www.tradingview.com/x/yiQDlFR6/

last chance for bulls to continue up to 770bln

3 Likes

There is some more room for this correction:

https://www.tradingview.com/x/DqlKBRwi/

Who knows maybe in case of so volatile and low liquidity market this kind of chart have more sense.

https://www.tradingview.com/x/FZybYlTj/

Next upwave (must be also impulse 12345) if occur (which is not so sure at the moment) can have max 1.23$ (in terms of 1hour chart candles close/line).

https://www.tradingview.com/x/0Bzsf7Y8/

Good expample of this rule (5th wave max 6x of wave 3rd) is TMC excluding BTC in 2017 (and high 01.2018)

There is no guarantee however that 5th wave always will have so extended ratio. It is only technical possibility! Can be shorter, or intraday can be even longer (on chart with full candles).

https://www.tradingview.com/x/OLQbJoAi/

If XEM can do this, all this structure will look like this on daily chart.

And TMC (exBTC) can do significant correction in any moment:

https://www.tradingview.com/x/BOiViJ6u/

ā€œiiiā€ (in 3rd of highest tier). This ā€œiiiā€ wave can be max 7x longer than wave ā€œiā€ on this chart.

I expect ā€œvā€ wave to finish in March, after that some more correction (many can think during this, that this is over of bubble), and spectacular 5th wave of highest tier that end this bubble somwhere in Summer:D

2 Likes

https://www.tradingview.com/x/PWwj9I8y/

The way to 766blns of capitalisation for altcoins looks parabolic, divergences means nothing in such trend.
https://www.tradingview.com/x/pDZWg662/

Iā€™ve found failure in my counting (rules must be respected in waves of every tier) of XEMUSD upmove from area of 22cents, and whole this growth to around 41cents looks like waves 1st and 3rd, and now 5th is lacking.

Max length for this lacking wave is like i wrote 6x of wave 3rd, so 90 cents from the bottom of wave 4th (we will know where will be this bottom, when it will be confirmed, now is around 37cents - unconfirmed.

Max time of duration of wave 4th is 2x time taken by wave 3rd, so there is time to 26.02 for wave 4th to be formed. Can be sonner than that of course (there is no minimum time for wave 4th).

1 Like

Hello.
Are you trading just NEM or you also trade other crypto pairs?
Why you have particular interest in trading NEM pairs?
Is it good for daily (weekly) trading?

Iā€™, m not a trader and i do not understand how you predict future
by looking at charts and indicators which reflects the past.

I also see you always mention 1:1 reward ratio.
Isnā€™t less risky to trade using (trading) to achieve 1:3 , 1:5 , ā€¦ or greater reward ratio?

Also i have a question about this chart.
https://www.tradingview.com/x/DqlKBRwi/

Why the 1st number 2 is set exactly under(near) 25th January and not before?
Is there a rule that says that x days should pass between before the dashed line is touched?
As you can see the line was touched the firs time somewhere on 21st January.

Thanks.

Hi:)

Now mainly i hodl more than trade (BTC, XLM, Ripple, XEM, Waves, Lisk-he started his pump, because we are in last stages of pumps for many coins. Some examples that i showed are to my personal use only, in case of 1:1 ratio it means of course higer risk/reward, but market choose this ratio very often (beside parabolic pumps, this ratio not works good in skyrocketing markets, only in sideways/flat moves). Risk is lower when i use XEMBTC pair, if something goes wrong with entry (no stop loss, only in mind) i have entry backed by Bitcoin and his still growing value, sometimes bad trades i must hodl little longer to retake BTC. This is complicated to describe. I dont advice to use this strategy, its for very patient people. Entries should not be more than 1% of capital or BTC owned.

Regarding waves counting, there are plenty of rules (Elliots Wave Theory is very complicated, many throwns it off). First stages are always hard to count because market is undecided and goes nearly flat. Yep this 25 January is the problem , but not so huge, because beginning of wave 1st can be moved even to 31January, an that what was before can belong to time of correction from high @30/32cents (depends on chart option, line or candles). Waves are not so good tool as it looks like to be, because of plenty possibilities of counting, but in rare cases market forms this waves so, that they can show some intresting possibilities. I dont know other way to estimate my price expectations much convenient, beside wishful thinking :slight_smile:

And this dashed line is other story, it connects point around 21January with low that is out of chart (Daily timeframe priceline), and attack on this line can indicate that whole growth from few cents to 41/42 is over (as wave A or 1st in higher tier for example, so it not mean end of growth in that situation only end of some wave). But for now i dont see any signs that it is even possible. So this line can be ignored.

The most important formation to fulfil for XEMUSD now is this

https://www.tradingview.com/x/WYHiu7wN/

Cup and handle formation (logarithmic chart) with target around 1$, it is now even better than wave counting to watch that formation, because market respected those solid black line and tends to build this 5th wave to minimum 1$.

All what is needed now is clear announcment from NEM Team about snapshot, and this 1$ is simply achieveable.

edit/

https://www.tradingview.com/x/Wy0XMNSA/

even this kind of counting is possible (1st and 3rd are 1:1 and 5th is 1.618 of 1st+3rd and 2.618 of 3rd)

and this 1st can be counted like this

https://www.tradingview.com/x/ruu2fp9j/

But only in priceline chart (1h) case. Candlesticks chart makes it more complicated.

https://www.tradingview.com/x/j46ZSYZ1/

This daily priceline gives intresting possibility.

Only that December 2019 and March 2020 lows makes some uncertainty. Priceline holds redline (wave 2nd of course should not exceed beginning of wave 1st), candlesticks shadows, not.

2 Likes

https://www.tradingview.com/x/As2PLuCx/

If the market will do 38.2 to 50 Fibo (blue) it can be likely correction typical for wave 3rd, if the market will do 50 to 61.8 (78.6 is too deep for my taste)
of black Fibo, this will be typical for 1st wave correction.

Blue rectangle is area where some bulls can try end this correction. If it is correction. In crypto nothing is for sure unfortunately.

https://www.tradingview.com/x/1E2bp51f/

Ichimoku players also can hunt in blue rectangle area.

https://www.tradingview.com/x/ycEPM4Xx/

Market does one more time panic moves because of double top formed here. Last time was even triple top and market smashed that in one big upmove huh.

https://www.tradingview.com/x/Ea0UV6Xj/

its sunday dump (was 7.02, and repeat now)

Funny thing @7.02 XEM was not so overreactive to broad alts market drop.

2 Likes

https://www.tradingview.com/x/ctpBAmHO/

besides cup and handle formation on logarithmic XEMUSD chart, XEMBTC has to do minimum upwave to around 3000satoshi (it is absolute minimum, can do of course more). No matter if we whole structure of waves sign with ABC or WXY or WXYXXZ when XX and Z is to do in future (XX also should reach 3000sat), market must do this wave, and will do!

https://www.tradingview.com/x/lLyRInVl/

Do You see some correlation (not in length or beta of waves but in timing of waves) with XEMUSD?

22january begining of wave 1st (TMCexBTC)
13February top of wave 3rd (TMCexBTC) not yet confirmed

I think also that ETHUSD is done (to minimum 10 March):

https://www.tradingview.com/x/joKIzIsS/

https://www.tradingview.com/x/LoNL0T1d/

should give some gains to the others, smaller and more perspectivic (joke)

2 Likes

Ormurinlangi does a good job and I respect his analyzes a lot but my vision is a little different.

Analyzing a cryptocurrency with a graph is really difficult.

It suffices for an investor or information to decide to intervene to change all the forecasts.

The bitcoin situation is very good and a lot of investors are coming.

Nem is also fashionable among the Japanese, banks, governments, big companies etc ā€¦

The solutions that Nem brings are a good investment.

We can therefore expect $ 1 before the end of February and $ 2 at the beginning of March and $ 5 at the end of 2021.

Depending on the contracts and the adoption of the financial and governmental world.

4 Likes

Thank You

I dā€™rather say our vision is similar, but with diffrent approach.

All markets works in waves. It is not hard to manipulate one coin with low liquidity, but with broad market its harder. Market respects rules of EWT, only multiple possibilities in smaller timeframes make it often hard to choose scenario, and market will chose at the end of the day own scenario, but always strickt in EWTheory and quasicrystals theory (i am not matematician, so i dont use quasicrystals unfortunately, tried use Ermanometry but this works poor).

Bubbles are natural outcome of speculation and mania. Bubbles and mania cant last perpetual. Cryptocurrencies (solid projects) will do good job even after bubble burst, because cryptotechnology has for sure more perspectives than FIAT money and ā€œmoney from the airā€ and from perpetual credit.

Price is only factor for speculators, in time of bubble can only strenghten awerness.

https://www.tradingview.com/x/uQVJe5eB/

Market played that double top, but not fulfiled yet the target, and must not do it, and if its true market will go higher. In such trend bearish price formations aare hard to fulfil.

XEM reflects these movements and respects the dotted line and support @ 32cents:

https://www.tradingview.com/x/TUsxurNS/

Ethereum is intresting story, because its wave 3rd in IIIrd tested 7x of wave 1st in IIIrd on daily priceline (7x is one of hard rules of EWT for this wave). Candlesticks chart has some room to 2000, but i wrote yesterday that for me ETH is done for a while, should do wave 4th in IIIrd to minimum 10March (10% time of wave 2nd in IIIrd).

https://www.tradingview.com/x/2wans6jf/

This small bearish H&S formation fulfiled with no problems. So uptrend in ETHUSD looks to weaken. In bullish trend formations like that should not be fulfiled.

BTC looks very bullish instead:

https://www.tradingview.com/x/KjCkr0mS/

After making wave 4th in IIIrd, makes now 5th wave, which is in early stages. Bad info is that 5th waves are FOMO waves, and are for seeking exit than entry. I still think BTC will do significant top in March somwhere between 80000-144000 (144000 as max possible 7x of wave Ist, that wave with 20000 previous bubble ATH)

https://www.tradingview.com/x/3au6CjpI/

https://www.tradingview.com/x/1gT2mJ3V/

This counting is also possible and corresponds better with ETHUSD (as a main participant of TMCexBTC)
In this case correction also has minimum time to 10/11 March.

It does not mean that few coins cant grow (especially those with smaller capitalisation). XEM can if some positive info will be shown. Without that, correction along with broad market. But this 1$ and after that (correction as wave B) maybe even 2$ will be made on XEM in March. That is my ā€œwishful thinkingā€ expectation, but with some technical ground.

Sooo Bitcoin first (after top on TMCexBTC is confirmed), somwhere in last stages of his 5th wave others should participate (after correction which is not even started yet), those with more awerness will participate more. March will be exiting time.

3 Likes

https://www.tradingview.com/x/P0NKNKcY/

i personally have some hope in that few days of pump, so correction will be moved few days in time respectively.

2 Likes

4 Likes

All is possible in XEMBTC chart, depends on BTCUSD volatility and moves, depends on demand from snapshot speculators :smiley: depends on broad market biasā€¦

https://www.tradingview.com/x/DjUSzu4m/

crucial moments

i wrote ETH is done but daily priceline chart is not so correct as full chart(with max possible 2000 before bigger correction), and waving of ETHUSD is more complicated than TMC

1 Like