Hello again my nemsters ! 
As a guy who wants to have an ideea of what’s coming in the near future, lately I’ve been “on a hunt” for all the web articles and youtube videos, in order to get a clue of what could be the projected price for XEM for the next 12 months from now.
Obviously I ended-up with a lot of confusing information, arguments from all the possible angles and as a result, I didn’t feel that the puzzle pieces were a lot more put together than before doing all that.
At the end of the day, it seems that everybody’s prediction is based more on emotion and wishful thinking rather than on some sort of objective evidence to point-out a realistic outcome. Don’t get me wrong, I’m including myself in this category as my previous posts prove that  .
.
But nevertheless, this time I decided to leave all my emotions behind and do some sort of objective analysis to get a picture of the future price or XEM for the next 12 months.
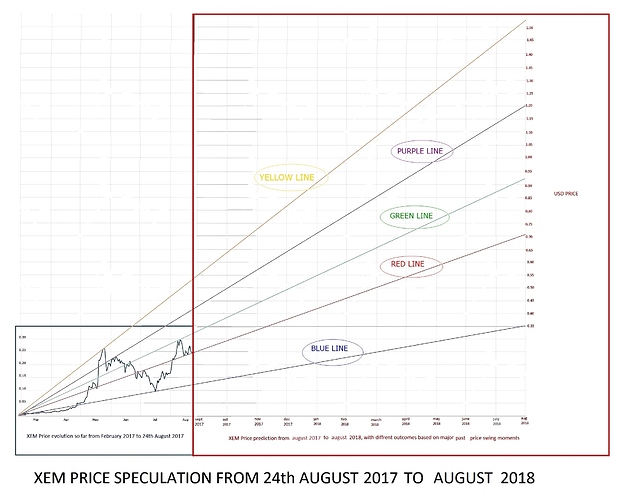
Therefore based on the chart taken from WorldCoinIndex from february 2017 to 24th august 2017, I drafted a chart based on XEM price fluctuations during this interval of time so far, which shows-up different outcomes for August 2018, from the most pessimistic scenario to the most optimistic one
I am aware that the graphical presentation is kind of mediocre but due to lack of technical skills, I did my best. At the end of the day, it’s the information we care about. Honestly, I did the chart in Paint, by hand, therefore, please don’t throw tomatoes at me  .
.
While the information in my chart might not be very accurate, I believe it gives us at least an ideea about a realistic future price of XEM for the next couple of months.
Below you have the chart I’ve made. Please CLICK on it to zoom-in. If zoom-in is no enough, download the picture and zoom-in from your desktop, and you should see the numbers clearely.
As you can see, we have 5 outcomes represented by 5 lines: yellow, purple, green, red, blue.
Keep in mind that when I’ve drafted this chart, I haven’t taken into consideration the upcoming events that will pump-up the XEM price (Catapult, NEM Exchange, Trezor, Comsa). The chart is showing XEM’s future price based on the progress it made so far, without any events that might pump it up. Altough, in the past XEM price got pumped due to a couple of breakthroughs and announcements, I believe that the upcoming events mentioned above, will have much more impact on the price than the ones in the past, therefore, even the most optimistic line (yellow) should be considered as rather conservative regarding expected price, while the blue one, it’s rather an apocalyptic scenario that personally, I find it very unlikely to happen.
The numbers for August 2018 are below as follows:
Yellow line: 1.53$
Purple line: 1.20$
Green line: 0.93$
Red line: 0.71$
Blue line: 0.35$
If I were to take into consideration the upcoming events in the near future I would add at least 50% increase to my predictions for each of the lines pointed in the chart, and even that I think it’s conservative.
Either way, you will see in my chart that XEM price goes-up anyway, and you will see by how much.
I am more than happy to receive replies with opinions, comments, analysis corrections, basically, let’s predict the price together, everybody is welcomed to drop an opinion. I would love to hear that from you.
Cheers ! 


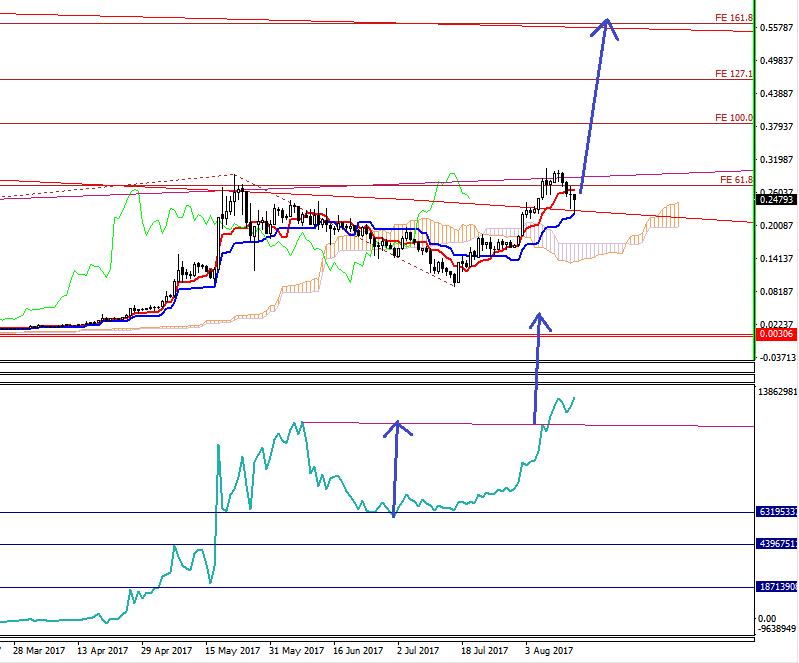
 ). If XEM could somewhat break 30cents, could easily fly to 50cents+ area. And 50cents can be in this case only shortterm obstacle to fly higher. And we should not look at other coins (Bitcoin, Ethereum etc.). Every coin has his own way.


 .
. .
.
